Monitoring and metrics
Configure PingIDM server logs and monitoring metrics.
Name changes for ForgeRock products
Product names changed when ForgeRock became part of Ping Identity.
The following name changes have been in effect since early 2024:
| Old name | New name |
|---|---|
ForgeRock Identity Cloud |
PingOne Advanced Identity Cloud |
ForgeRock Access Management |
PingAM |
ForgeRock Directory Services |
PingDS |
ForgeRock Identity Management |
PingIDM |
ForgeRock Identity Gateway |
PingGateway |
Learn more about the name changes in New names for ForgeRock products in the Knowledge Base.
Server logs
IDM uses logback to generate server logs.
Prior to 8.0, IDM used java.util.logging (JUL) to generate its logs. Learn more about producing logs in the older format in PatternLayoutEncoder and Configuring ConsoleAppender.
|
Server logging is not the same as the audit service. The audit service logs activity on the IDM system, such as access, and synchronization. Server logging records information about the internal workings of IDM, such as system messages, error reporting, service loading, and startup and shutdown messaging.
The default location for the server logging configuration file is your project’s conf/logback.xml file. You can configure this location by setting the LOGGING_CONFIG environment variable in your project’s startup.sh file.
Changes to logging settings take effect without restarting the server. You can configure the interval at which the system scans for updates using the following tag:
<configuration scan="true" scanPeriod="30 seconds">You can specify a global logging level:
<root level="INFO">
    <appender-ref ref="console" />
    <appender-ref ref="file" />
</root>
Log appenders
The way IDM logs messages is set in <appender> tags in the logback.xml file. The two default appenders are:
-
RollingFileAppenderwrites formatted log records to a single file or to a set of rotating log files. By default, log files are written tologs/openidm*.logfiles. Rotated files will have a date within the file name, such asopenidm-2025-03-11.log. -
ConsoleAppenderwrites formatted logs toSystem.out.
Additional log message handlers are listed in the logback.xml file.
Configuring RollingFileAppender
The rolling file appender writes formatted log records to a single file or to a set of rotating log files. To configure it, you might need to:
-
Update the
<file>tag to contain the path to your default log file. -
Set the
ThresholdFilterto the minimum log level for your appender. -
Enable or disable the
logger.LogbackLogFilter. -
Configure the
<RollingPolicy>. -
Specify the
<encoder>.
The file appender supports the following configuration tags:
- <file>
-
Contains the path for the default log file, for example:
<file>path/to/openidm/logs/logback.log</file> - <filter>
-
Filters log events. Use
class="ThresholdFilter"and the<level>tag to configure the log level. This should generally be the minimum log level for your appender, for example:<filter class="ThresholdFilter"> <level>TRACE</level> </filter>Use
class="org.forgerock.openidm.logger.LogbackLogFilter"to filter some common "noise" from the logs, for example:<filter class="org.forgerock.openidm.logger.LogbackLogFilter" />
- <rollingPolicy>
-
Controls the system’s behavior during log rotation. By default, this is
TimeBasedRollingPolicywith a daily rolling option.SizeAndTimeBasedRollingPolicyis also supported, though you should only use it in cases where performance is not a concern.Learn more about rolling policies in the logback documentation.
- <encoder>
-
Controls the system’s log message format. By default, this is
JsonEncoder, thoughPatternLayoutEncoderis also supported.Learn more about encoders in the logback documentation.
Configuring ConsoleAppender
ConsoleAppender writes formatted logs to System.out. To configure it, you might need to:
-
Set the
ThresholdFilterto the minimum required logging level. -
Enable or disable the
logger.LogbackLogFilter. -
Specify the
<encoder>.
The console appender has the following tags:
- <filter>
-
Filters log events. Use
class="ThresholdFilter"and the<level>tag to configure the logging level, for example:<filter class="ThresholdFilter"> <level>TRACE</level> </filter>Use
class="org.forgerock.openidm.logger.LogbackLogFilter"to filter some common "noisy" entries from the logs, for example:<filter class="org.forgerock.openidm.logger.LogbackLogFilter" /> - <encoder>
-
Controls the system’s log message format. By default, this is
JsonEncoder.Learn more about encoders in the logback documentation.
Log encoders
IDM supports two log encoders:
-
JsonEncoderoutputs logs as a JSON object. This is the default and recommended encoder for most purposes.Example JSON output{ "timestamp": 1738355903784, "level": "DEBUG", "threadName": "persisted_1738355821854_QuartzSchedulerThread", "loggerName": "org.forgerock.openidm.quartz.RepoJobStore", "context": { "name": "default", "birthdate": 1738355793181, "properties": {} }, "mdc": {}, "formattedMessage": "Processing 0 deferred Trigger Job Completions", "throwable": null }Learn more about
JsonEncoderin the logback documentation.
-
PatternLayoutEncoderoutputs a text log file which emulates thejava.util.loggingformat. Enabling this option will generate logs in the same format as past versions of IDM. To enable, replace theJsonEncoderwith thePatternLayoutEncoderprovided in the code comments ofconf/logback.xml.Example Pattern Layout output[19] May 23, 2018 10:30:26.959 AM org.forgerock.openidm.repo.opendj.impl.Activator start INFO: Registered bootstrap repository service [19] May 23, 2018 10:30:26.960 AM org.forgerock.openidm.repo.opendj.impl.Activator start INFO: DS bundle started
Learn more about
PatternLayoutEncoderin the logback documentation.
Log levels
Logging levels are controlled by <filter class="ThresholdFilter"> tags contained within an <appender> tag in conf/logback.xml. For example, this tag filters events with a level below DEBUG:
<filter class="ThresholdFilter">
    <level>DEBUG</level>
</filter>
The following table lists the supported threshold filter values in descending order from most to least general and includes the equivalent level in the previously supported java.util.logging:
| Logback threshold | java.util.logging threshold |
|---|---|
ERROR |
SEVERE |
WARN |
WARNING |
INFO |
INFO |
DEBUG |
FINE |
DEBUG |
FINER |
TRACE |
FINEST |
Set the threshold value to OFF to disable logging.
Learn more about threshold values in the logback documentation.
You can specify different logging levels for individual server features which override the global logging level. For example:
<!-- Commons api.models and OpenApiTransformer (API Descriptor) is noisy at INFO level -->
<logger name="org.forgerock.api.models" level="WARN" />
<logger name="org.forgerock.api.transform.OpenApiTransformer" level="WARN" />
<!-- Logs the output from OSGi logging -->
<logger name="org.forgerock.openidm.Framework" level="WARN" />
<!-- On restart the BarURLHandler can create warning noise -->
<logger name="org.activiti.osgi.BarURLHandler" level="ERROR" />
If you use logger functions in your JavaScript scripts, set the log level for the scripts as follows:
<logger name="org.forgerock.openidm.script.javascript.JavaScript" level="level" />You can override the log level settings, per script, with the following setting:
<logger name="org.forgerock.openidm.script.javascript.JavaScript.script-name" level="level" />Monitoring
IDM includes the following tools for monitoring metrics:
-
A Dropwizard dashboard widget, for viewing metrics within IDM.
Widgets are deprecated and will be removed in a future release of IDM. For more information, refer to Deprecation. -
A Prometheus endpoint, for viewing metrics through external resources such as Prometheus and Grafana.
Enable metrics
IDM does not collect metrics by default. To enable metrics collection, open conf/metrics.json and set the enabled property to true:
{
    "enabled" : true
}
After you have enabled metrics, the following command returns all collected metrics:
curl \
--header "X-OpenIDM-Username: openidm-admin" \
--header "X-OpenIDM-Password: openidm-admin" \
--header "Accept-API-Version: resource=1.0" \
--request GET \
'http://localhost:8080/openidm/metrics/api?_queryFilter=true'
Show example response
{
  "result": [
    {
      "_id": "repo.ds.get-connection",
      "count": 5,
      "max": 0.033023,
      "mean": 0.01632066766586218,
      "min": 0.006605,
      "p50": 0.007868,
      "p75": 0.026865999999999998,
      "p95": 0.033023,
      "p98": 0.033023,
      "p99": 0.033023,
      "p999": 0.033023,
      "stddev": 0.011254712526201813,
      "m15_rate": 0.0,
      "m1_rate": 0.0,
      "m5_rate": 0.0,
      "mean_rate": 1.5494157682573269,
      "duration_units": "milliseconds",
      "rate_units": "calls/second",
      "total": 0.081915,
      "_type": "timer"
    },
    {
      "_id": "jvm.memory-usage.pools.G1-Old-Gen.committed",
      "value": 794820608,
      "_type": "gauge"
    },
    {
      "_id": "jvm.max-memory",
      "value": 2147483648,
      "_type": "gauge"
    },
    {
      "_id": "jvm.memory-usage.pools.CodeHeap-'non-profiled-nmethods'.init",
      "value": 2555904.0,
      "_type": "gauge"
    },
    {
      "_id": "jvm.memory-usage.pools.G1-Old-Gen.init",
      "value": 2.03423744E+9,
      "_type": "gauge"
    },
    {
      "_id": "jvm.memory-usage.pools.init_G1-Survivor-Space",
      "value": 0.0,
      "_type": "gauge"
    },
    {
      "_id": "jvm.memory-usage.total.max",
      "value": 2147483647,
      "_type": "gauge"
    },
    {
      "_id": "jvm.memory-usage.total.committed",
      "value": 2359099392,
      "_type": "gauge"
    },
    {
      "_id": "jvm.memory-usage.heap.init",
      "value": 2147483648,
      "_type": "gauge"
    },
    {
      "_id": "jvm.memory-usage.init_heap",
      "value": 2147483648,
      "_type": "gauge"
    },
    {
      "_id": "repo.ds.update.cluster",
      "count": 1,
      "max": 5.685331,
      "mean": 5.685331,
      "min": 5.685331,
      "p50": 5.685331,
      "p75": 5.685331,
      "p95": 5.685331,
      "p98": 5.685331,
      "p99": 5.685331,
      "p999": 5.685331,
      "stddev": 0.0,
      "m15_rate": 0.0,
      "m1_rate": 0.0,
      "m5_rate": 0.0,
      "mean_rate": 0.548450244910786,
      "duration_units": "milliseconds",
      "rate_units": "calls/second",
      "total": 5.685331,
      "_type": "timer"
    },
    {
      "_id": "jvm.thread-state_blocked",
      "value": 0.0,
      "_type": "gauge"
    },
    {
      "_id": "repo.ds.read.cluster",
      "count": 1,
      "max": 2.404851,
      "mean": 2.404851,
      "min": 2.404851,
      "p50": 2.404851,
      "p75": 2.404851,
      "p95": 2.404851,
      "p98": 2.404851,
      "p99": 2.404851,
      "p999": 2.404851,
      "stddev": 0.0,
      "m15_rate": 0.0,
      "m1_rate": 0.0,
      "m5_rate": 0.0,
      "mean_rate": 0.5469820381458513,
      "duration_units": "milliseconds",
      "rate_units": "calls/second",
      "total": 2.404851,
      "_type": "timer"
    },
    {
      "_id": "jvm.memory-usage.pools.max_G1-Eden-Space",
      "value": -1.0,
      "_type": "gauge"
    },
    {
      "_id": "jvm.free-memory",
      "value": 1147588736,
      "_type": "gauge"
    },
    {
      "_id": "jvm.memory-usage.pools.CodeHeap-'non-nmethods'.usage",
      "value": 0.3304220516962843,
      "_type": "gauge"
    },
    {
      "_id": "jvm.memory-usage.init_non-heap",
      "value": 7667712.0,
      "_type": "gauge"
    },
    {
      "_id": "jvm.memory-usage.pools.used_G1-Old-Gen",
      "value": 118043136,
      "_type": "gauge"
    },
    {
      "_id": "jvm.memory-usage.pools.used_CodeHeap-'non-nmethods'",
      "value": 2513280.0,
      "_type": "gauge"
    },
    {
      "_id": "jvm.memory-usage.pools.Metaspace.init",
      "value": 0.0,
      "_type": "gauge"
    },
    {
      "_id": "jvm.class-loading.unloaded.total",
      "count": 1,
      "_type": "counter"
    },
    {
      "_id": "jvm.memory-usage.pools.committed_Metaspace",
      "value": 145227776,
      "_type": "gauge"
    },
    {
      "_id": "jvm.memory-usage.pools.G1-Survivor-Space.committed",
      "value": 75497472,
      "_type": "gauge"
    },
    {
      "_id": "jvm.memory-usage.heap.usage",
      "value": 0.46512436866760254,
      "_type": "gauge"
    },
    {
      "_id": "jvm.memory-usage.pools.init_G1-Eden-Space",
      "value": 113246208,
      "_type": "gauge"
    },
    {
      "_id": "jvm.garbage-collector.G1-Old-Generation.count",
      "value": 0.0,
      "_type": "gauge"
    },
    {
      "_id": "jvm.thread-state.waiting.count",
      "value": 54.0,
      "_type": "gauge"
    },
    {
      "_id": "jvm.memory-usage.pools.used_CodeHeap-'profiled-nmethods'",
      "value": 30778496,
      "_type": "gauge"
    },
    {
      "_id": "jvm.class-loading.loaded",
      "value": 22757.0,
      "_type": "gauge"
    },
    {
      "_id": "jvm.available-cpus",
      "value": 16.0,
      "_type": "gauge"
    },
    {
      "_id": "jvm.memory-usage.pools.max_G1-Old-Gen",
      "value": 2147483648,
      "_type": "gauge"
    },
    {
      "_id": "jvm.memory-usage.pools.max_Metaspace",
      "value": -1.0,
      "_type": "gauge"
    },
    {
      "_id": "jvm.memory-usage.pools.CodeHeap-'non-profiled-nmethods'.committed",
      "value": 11730944,
      "_type": "gauge"
    },
    {
      "_id": "jvm.used-memory",
      "value": 2147483648,
      "_type": "gauge"
    },
    {
      "_id": "scheduler.job-store.repo.query-list.triggers",
      "count": 1,
      "max": 3.064977,
      "mean": 3.064977,
      "min": 3.064977,
      "p50": 3.064977,
      "p75": 3.064977,
      "p95": 3.064977,
      "p98": 3.064977,
      "p99": 3.064977,
      "p999": 3.064977,
      "stddev": 0.0,
      "m15_rate": 0.0,
      "m1_rate": 0.0,
      "m5_rate": 0.0,
      "mean_rate": 0.30915432245454577,
      "duration_units": "milliseconds",
      "rate_units": "calls/second",
      "total": 3.064977,
      "_type": "timer"
    },
    {
      "_id": "jvm.memory-usage.total.init",
      "value": 2.15515136E+9,
      "_type": "gauge"
    },
    {
      "_id": "jvm.memory-usage.pools.CodeHeap-'non-nmethods'.used",
      "value": 2513280.0,
      "_type": "gauge"
    },
    {
      "_id": "jvm.memory-usage.pools.G1-Eden-Space.init",
      "value": 113246208,
      "_type": "gauge"
    },
    {
      "_id": "jvm.memory-usage.pools.Metaspace.usage",
      "value": 0.9798155967078914,
      "_type": "gauge"
    },
    {
      "_id": "jvm.memory-usage.pools.G1-Eden-Space.max",
      "value": -1.0,
      "_type": "gauge"
    },
    {
      "_id": "jvm.memory-usage.pools.init_Compressed-Class-Space",
      "value": 0.0,
      "_type": "gauge"
    },
    {
      "_id": "jvm.memory-usage.pools.G1-Old-Gen.max",
      "value": 2147483648,
      "_type": "gauge"
    },
    {
      "_id": "jvm.memory-usage.pools.init_CodeHeap-'profiled-nmethods'",
      "value": 2555904.0,
      "_type": "gauge"
    },
    {
      "_id": "jvm.memory-usage.total.used",
      "value": 1202003416,
      "_type": "gauge"
    },
    {
      "_id": "jvm.memory-usage.pools.used_Compressed-Class-Space",
      "value": 1.63824E+7,
      "_type": "gauge"
    },
    {
      "_id": "authorization-check.full-check",
      "count": 1,
      "max": 1.8842489999999998,
      "mean": 1.8842489999999998,
      "min": 1.8842489999999998,
      "p50": 1.8842489999999998,
      "p75": 1.8842489999999998,
      "p95": 1.8842489999999998,
      "p98": 1.8842489999999998,
      "p99": 1.8842489999999998,
      "p999": 1.8842489999999998,
      "stddev": 0.0,
      "m15_rate": 0.0,
      "m1_rate": 0.0,
      "m5_rate": 0.0,
      "mean_rate": 82.67584677222334,
      "duration_units": "milliseconds",
      "rate_units": "calls/second",
      "total": 1.884249,
      "_type": "timer"
    },
    {
      "_id": "jvm.memory-usage.pools.committed_G1-Eden-Space",
      "value": 1277165568,
      "_type": "gauge"
    },
    {
      "_id": "jvm.memory-usage.pools.used_Metaspace",
      "value": 142296984,
      "_type": "gauge"
    },
    {
      "_id": "jvm.memory-usage.pools.CodeHeap-'profiled-nmethods'.used",
      "value": 30785408,
      "_type": "gauge"
    },
    {
      "_id": "jvm.memory-usage.pools.G1-Survivor-Space.init",
      "value": 0.0,
      "_type": "gauge"
    },
    {
      "_id": "jvm.memory-usage.non-heap.max",
      "value": -1.0,
      "_type": "gauge"
    },
    {
      "_id": "jvm.memory-usage.pools.G1-Survivor-Space.max",
      "value": -1.0,
      "_type": "gauge"
    },
    {
      "_id": "jvm.memory-usage.pools.CodeHeap-'profiled-nmethods'.max",
      "value": 122023936,
      "_type": "gauge"
    },
    {
      "_id": "jvm.thread-state.daemon.count",
      "value": 66.0,
      "_type": "gauge"
    },
    {
      "_id": "jvm.memory-usage.pools.G1-Eden-Space.used-after-gc",
      "value": 0.0,
      "_type": "gauge"
    },
    {
      "_id": "jvm.thread-state.new.count",
      "value": 0.0,
      "_type": "gauge"
    },
    {
      "_id": "jvm.memory-usage.pools.max_G1-Survivor-Space",
      "value": -1.0,
      "_type": "gauge"
    },
    {
      "_id": "repo.ds.query._adhoc-filter.cluster",
      "count": 2,
      "max": 2.625038,
      "mean": 2.2533855,
      "min": 1.8817329999999999,
      "p50": 2.625038,
      "p75": 2.625038,
      "p95": 2.625038,
      "p98": 2.625038,
      "p99": 2.625038,
      "p999": 2.625038,
      "stddev": 0.3716525,
      "m15_rate": 0.0,
      "m1_rate": 0.0,
      "m5_rate": 0.0,
      "mean_rate": 1.096972198056336,
      "duration_units": "milliseconds",
      "rate_units": "calls/second",
      "total": 4.506771,
      "_type": "timer"
    },
    {
      "_id": "jvm.memory-usage.pools.G1-Eden-Space.used",
      "value": 805306368,
      "_type": "gauge"
    },
    {
      "_id": "jvm.garbage-collector.G1-Young-Generation.time",
      "value": 238.0,
      "_type": "gauge"
    },
    {
      "_id": "jvm.memory-usage.pools.CodeHeap-'non-profiled-nmethods'.max",
      "value": 122028032,
      "_type": "gauge"
    },
    {
      "_id": "jvm.memory-usage.heap.used",
      "value": 998846976,
      "_type": "gauge"
    },
    {
      "_id": "jvm.memory-usage.pools.max_Compressed-Class-Space",
      "value": 1073741824,
      "_type": "gauge"
    },
    {
      "_id": "jvm.class-loading.unloaded",
      "value": 1.0,
      "_type": "gauge"
    },
    {
      "_id": "jvm.memory-usage.pools.init_CodeHeap-'non-profiled-nmethods'",
      "value": 2555904.0,
      "_type": "gauge"
    },
    {
      "_id": "jvm.memory-usage.pools.G1-Eden-Space.committed",
      "value": 1277165568,
      "_type": "gauge"
    },
    {
      "_id": "jvm.memory-usage.pools.used-after-gc_G1-Eden-Space",
      "value": 0.0,
      "_type": "gauge"
    },
    {
      "_id": "jvm.memory-usage.pools.max_CodeHeap-'non-nmethods'",
      "value": 7606272.0,
      "_type": "gauge"
    },
    {
      "_id": "jvm.class-loading.loaded.total",
      "count": 22757,
      "_type": "counter"
    },
    {
      "_id": "jvm.memory-usage.heap.max",
      "value": 2147483648,
      "_type": "gauge"
    },
    {
      "_id": "jvm.memory-usage.pools.init_G1-Old-Gen",
      "value": 2.03423744E+9,
      "_type": "gauge"
    },
    {
      "_id": "jvm.memory-usage.pools.Metaspace.used",
      "value": 142301024,
      "_type": "gauge"
    },
    {
      "_id": "jvm.memory-usage.non-heap.used",
      "value": 203165728,
      "_type": "gauge"
    },
    {
      "_id": "jvm.thread-state_new",
      "value": 0.0,
      "_type": "gauge"
    },
    {
      "_id": "user.session.static-user",
      "m15_rate": 0.0,
      "m1_rate": 0.0,
      "m5_rate": 0.0,
      "mean_rate": 66.81303621219794,
      "units": "events/second",
      "total": 1.0,
      "count": 1,
      "_type": "summary"
    },
    {
      "_id": "jvm.memory-usage.pools.Compressed-Class-Space.usage",
      "value": 0.015257298946380615,
      "_type": "gauge"
    },
    {
      "_id": "jvm.memory-usage.used_non-heap",
      "value": 203165952,
      "_type": "gauge"
    },
    {
      "_id": "jvm.memory-usage.pools.committed_G1-Old-Gen",
      "value": 794820608,
      "_type": "gauge"
    },
    {
      "_id": "jvm.memory-usage.non-heap.usage",
      "value": 0.9597728811919505,
      "_type": "gauge"
    },
    {
      "_id": "jvm.thread-state_waiting",
      "value": 54.0,
      "_type": "gauge"
    },
    {
      "_id": "jvm.memory-usage.pools.init_CodeHeap-'non-nmethods'",
      "value": 2555904.0,
      "_type": "gauge"
    },
    {
      "_id": "jvm.memory-usage.pools.CodeHeap-'profiled-nmethods'.init",
      "value": 2555904.0,
      "_type": "gauge"
    },
    {
      "_id": "jvm.memory-usage.pools.committed_CodeHeap-'non-nmethods'",
      "value": 4390912.0,
      "_type": "gauge"
    },
    {
      "_id": "jvm.memory-usage.pools.max_CodeHeap-'profiled-nmethods'",
      "value": 122023936,
      "_type": "gauge"
    },
    {
      "_id": "jvm.memory-usage.pools.Compressed-Class-Space.init",
      "value": 0.0,
      "_type": "gauge"
    },
    {
      "_id": "jvm.thread-state_runnable",
      "value": 67.0,
      "_type": "gauge"
    },
    {
      "_id": "jvm.memory-usage.pools.G1-Old-Gen.used",
      "value": 118043136,
      "_type": "gauge"
    },
    {
      "_id": "jvm.thread-state.timed_waiting.count",
      "value": 39.0,
      "_type": "gauge"
    },
    {
      "_id": "jvm.memory-usage.pools.G1-Old-Gen.usage",
      "value": 0.05496811866760254,
      "_type": "gauge"
    },
    {
      "_id": "jvm.garbage-collector.time.total_G1-Young-Generation",
      "count": 238,
      "_type": "counter"
    },
    {
      "_id": "jvm.thread-state_terminated",
      "value": 0.0,
      "_type": "gauge"
    },
    {
      "_id": "jvm.memory-usage.pools.CodeHeap-'non-profiled-nmethods'.usage",
      "value": 0.09162589789205156,
      "_type": "gauge"
    },
    {
      "_id": "jvm.memory-usage.max_non-heap",
      "value": -1.0,
      "_type": "gauge"
    },
    {
      "_id": "jvm.garbage-collector.G1-Young-Generation.count",
      "value": 16.0,
      "_type": "gauge"
    },
    {
      "_id": "jvm.thread-state.terminated.count",
      "value": 0.0,
      "_type": "gauge"
    },
    {
      "_id": "jvm.garbage-collector.G1-Old-Generation.time",
      "value": 0.0,
      "_type": "gauge"
    },
    {
      "_id": "jvm.memory-usage.heap.committed",
      "value": 2147483648,
      "_type": "gauge"
    },
    {
      "_id": "jvm.garbage-collector.time.total_G1-Old-Generation",
      "count": 0,
      "_type": "counter"
    },
    {
      "_id": "jvm.memory-usage.pools.Metaspace.committed",
      "value": 145293312,
      "_type": "gauge"
    },
    {
      "_id": "jvm.memory-usage.pools.init_Metaspace",
      "value": 0.0,
      "_type": "gauge"
    },
    {
      "_id": "jvm.memory-usage.pools.CodeHeap-'non-nmethods'.committed",
      "value": 4390912.0,
      "_type": "gauge"
    },
    {
      "_id": "jvm.memory-usage.non-heap.committed",
      "value": 2.1168128E+8,
      "_type": "gauge"
    },
    {
      "_id": "jvm.memory-usage.max_heap",
      "value": 2147483648,
      "_type": "gauge"
    },
    {
      "_id": "jvm.memory-usage.pools.G1-Survivor-Space.usage",
      "value": 1.0,
      "_type": "gauge"
    },
    {
      "_id": "jvm.thread-state_timed_waiting",
      "value": 39.0,
      "_type": "gauge"
    },
    {
      "_id": "jvm.memory-usage.committed_heap",
      "value": 2147483648,
      "_type": "gauge"
    },
    {
      "_id": "jvm.memory-usage.committed_non-heap",
      "value": 2.1168128E+8,
      "_type": "gauge"
    },
    {
      "_id": "jvm.memory-usage.pools.max_CodeHeap-'non-profiled-nmethods'",
      "value": 122028032,
      "_type": "gauge"
    },
    {
      "_id": "jvm.memory-usage.pools.committed_G1-Survivor-Space",
      "value": 75497472,
      "_type": "gauge"
    },
    {
      "_id": "jvm.thread-state.blocked.count",
      "value": 0.0,
      "_type": "gauge"
    },
    {
      "_id": "jvm.memory-usage.used_heap",
      "value": 998846976,
      "_type": "gauge"
    },
    {
      "_id": "jvm.garbage-collector.count.total_G1-Old-Generation",
      "count": 0,
      "_type": "counter"
    },
    {
      "_id": "jvm.memory-usage.pools.used_G1-Survivor-Space",
      "value": 75497472,
      "_type": "gauge"
    },
    {
      "_id": "jvm.memory-usage.pools.G1-Survivor-Space.used-after-gc",
      "value": 6630416.0,
      "_type": "gauge"
    },
    {
      "_id": "authorization-check.router-authz",
      "count": 1,
      "max": 1.7509839999999999,
      "mean": 1.7509839999999999,
      "min": 1.7509839999999999,
      "p50": 1.7509839999999999,
      "p75": 1.7509839999999999,
      "p95": 1.7509839999999999,
      "p98": 1.7509839999999999,
      "p99": 1.7509839999999999,
      "p999": 1.7509839999999999,
      "stddev": 0.0,
      "m15_rate": 0.0,
      "m1_rate": 0.0,
      "m5_rate": 0.0,
      "mean_rate": 61.599943968690965,
      "duration_units": "milliseconds",
      "rate_units": "calls/second",
      "total": 1.750984,
      "_type": "timer"
    },
    {
      "_id": "jvm.memory-usage.pools.committed_Compressed-Class-Space",
      "value": 17629184,
      "_type": "gauge"
    },
    {
      "_id": "jvm.memory-usage.pools.G1-Eden-Space.usage",
      "value": 0.6305418719211823,
      "_type": "gauge"
    },
    {
      "_id": "jvm.memory-usage.pools.CodeHeap-'non-profiled-nmethods'.used",
      "value": 11180928,
      "_type": "gauge"
    },
    {
      "_id": "repo.ds.query._adhoc-filter.scheduler",
      "count": 1,
      "max": 2.687975,
      "mean": 2.687975,
      "min": 2.687975,
      "p50": 2.687975,
      "p75": 2.687975,
      "p95": 2.687975,
      "p98": 2.687975,
      "p99": 2.687975,
      "p999": 2.687975,
      "stddev": 0.0,
      "m15_rate": 0.0,
      "m1_rate": 0.0,
      "m5_rate": 0.0,
      "mean_rate": 0.3087729850177765,
      "duration_units": "milliseconds",
      "rate_units": "calls/second",
      "total": 2.687975,
      "_type": "timer"
    },
    {
      "_id": "jvm.memory-usage.pools.committed_CodeHeap-'profiled-nmethods'",
      "value": 32636928,
      "_type": "gauge"
    },
    {
      "_id": "jvm.memory-usage.pools.used_CodeHeap-'non-profiled-nmethods'",
      "value": 11180928,
      "_type": "gauge"
    },
    {
      "_id": "jvm.garbage-collector.count.total_G1-Young-Generation",
      "count": 16,
      "_type": "counter"
    },
    {
      "_id": "jvm.memory-usage.pools.G1-Survivor-Space.used",
      "value": 75497472,
      "_type": "gauge"
    },
    {
      "_id": "jvm.memory-usage.pools.committed_CodeHeap-'non-profiled-nmethods'",
      "value": 11730944,
      "_type": "gauge"
    },
    {
      "_id": "jvm.memory-usage.pools.used_G1-Eden-Space",
      "value": 805306368,
      "_type": "gauge"
    },
    {
      "_id": "jvm.thread-state.daemon",
      "value": 66.0,
      "_type": "gauge"
    },
    {
      "_id": "jvm.memory-usage.pools.Compressed-Class-Space.committed",
      "value": 17629184,
      "_type": "gauge"
    },
    {
      "_id": "jvm.thread-state.count",
      "value": 160.0,
      "_type": "gauge"
    },
    {
      "_id": "jvm.memory-usage.pools.CodeHeap-'non-nmethods'.init",
      "value": 2555904.0,
      "_type": "gauge"
    },
    {
      "_id": "audit.authentication",
      "m15_rate": 0.0,
      "m1_rate": 0.0,
      "m5_rate": 0.0,
      "mean_rate": 57.05540262171857,
      "units": "events/second",
      "total": 1.0,
      "count": 1,
      "_type": "summary"
    },
    {
      "_id": "jvm.memory-usage.non-heap.init",
      "value": 7667712.0,
      "_type": "gauge"
    },
    {
      "_id": "jvm.thread-state.runnable.count",
      "value": 67.0,
      "_type": "gauge"
    },
    {
      "_id": "jvm.memory-usage.pools.CodeHeap-'profiled-nmethods'.committed",
      "value": 32636928,
      "_type": "gauge"
    },
    {
      "_id": "jvm.memory-usage.pools.Metaspace.max",
      "value": -1.0,
      "_type": "gauge"
    },
    {
      "_id": "jvm.memory-usage.pools.used-after-gc_G1-Old-Gen",
      "value": 0.0,
      "_type": "gauge"
    },
    {
      "_id": "jvm.memory-usage.pools.used-after-gc_G1-Survivor-Space",
      "value": 6630416.0,
      "_type": "gauge"
    },
    {
      "_id": "jvm.memory-usage.pools.G1-Old-Gen.used-after-gc",
      "value": 0.0,
      "_type": "gauge"
    },
    {
      "_id": "jvm.memory-usage.pools.Compressed-Class-Space.max",
      "value": 1073741824,
      "_type": "gauge"
    },
    {
      "_id": "jvm.memory-usage.pools.CodeHeap-'non-nmethods'.max",
      "value": 7606272.0,
      "_type": "gauge"
    },
    {
      "_id": "jvm.memory-usage.pools.CodeHeap-'profiled-nmethods'.usage",
      "value": 0.252550057064214,
      "_type": "gauge"
    },
    {
      "_id": "jvm.memory-usage.pools.Compressed-Class-Space.used",
      "value": 1.63824E+7,
      "_type": "gauge"
    },
    {
      "_id": "jvm.free-used-memory",
      "value": 1146838232,
      "_type": "gauge"
    }
  ],
  "resultCount": 142,
  "pagedResultsCookie": null,
  "totalPagedResultsPolicy": "EXACT",
  "totalPagedResults": 142,
  "remainingPagedResults": -1
}| Some metrics in the sample response are deprecated. |
| Metrics are only collected after they have been triggered by activity in IDM, such as a reconciliation. |
Learn more:
Dropwizard widget
| Widgets are deprecated and will be removed in a future release of IDM. For more information, refer to Deprecation. |
The Dropwizard widget creates a graph of metrics based on server activity and is useful for lightweight, live monitoring of IDM. The widget has the following limitations:
-
The graph created by the widget does not persist. If you reload or navigate away from the page, the graph restarts.
-
The widget only works with time-based metrics.
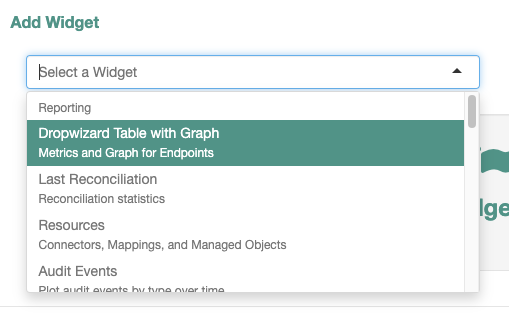
To add the Dropwizard widget:
-
From the navigation bar, click Dashboards > Dashboard Name.
-
On the Dashboard Name page, click Add Widget.
-
In the Add Widget window, from the Select a Widget drop-down list, select Dropwizard Table with Graph.
-
To preview any metric on the graph, click Add to Graph adjacent to any metric.
-
Click Add.
The Dropwizard widget now displays on the dashboard.
Prometheus endpoint
This topic describes how to configure Prometheus and Grafana to collect IDM metrics. These third-party tools are not supported by Ping. Refer to the Prometheus documentation.
Prometheus is a third-party tool used for gathering and processing monitoring data. Prometheus uses the openidm/metrics/prometheus endpoint to gather information. This endpoint is protected by a basic authentication filter, using the following credentials, set in the resolver/boot.properties file:
openidm.prometheus.username=username
openidm.prometheus.password=password|
Storing secrets and passwords directly in configuration and property files is deprecated. The Prometheus endpoint supports Secret stores for secret resolution. |
Disable Prometheus
To disable IDM’s Prometheus handler:
-
Comment out or remove
openidm.prometheus.usernameandopenidm.prometheus.passwordfrom theresolver/boot.propertiesfile. -
Remove or don’t define the
idm.prometheus.credentialspurpose.If these properties and purpose aren’t set, IDM doesn’t enable the Prometheus handler.
Configure Prometheus
-
Download Prometheus.
-
Create a
prometheus.ymlconfiguration file. For more information, refer to the Prometheus configuration documentation. An exampleprometheus.ymlfile:global: scrape_interval: 15s external_labels: monitor: 'my_prometheus' # https://prometheus.io/docs/operating/configuration/#scrape_config scrape_configs: - job_name: 'openidm' scrape_interval: 15s scrape_timeout: 5s metrics_path: 'openidm/metrics/prometheus' scheme: http basic_auth: username: 'prometheus' password: 'prometheus' static_configs: - targets: ['localhost:8080']This example configures Prometheus to poll the
openidm/metrics/prometheusendpoint every 5 seconds (scrape_interval: 5s), receiving metrics in a plain text format (_fields: ['text']and_mimeType: ['text/plain;version=0.0.4']). For more information about reporting formats, refer to the Prometheus documentation on Exposition Formats. -
Verify the configuration returns metric results:
Requestcurl \ --user prometheus:prometheus \ --header "Accept-API-Version: resource=1.0" \ --request GET \ 'http://localhost:8080/openidm/metrics/prometheus'Show example response
Response# HELP idm_jvm_available_cpus Automatically generated # TYPE idm_jvm_available_cpus gauge idm_jvm_available_cpus 10.0 # HELP idm_jvm_class_loading_loaded Automatically generated # TYPE idm_jvm_class_loading_loaded gauge idm_jvm_class_loading_loaded 24876.0 # HELP idm_jvm_class_loading_unloaded Automatically generated # TYPE idm_jvm_class_loading_unloaded gauge idm_jvm_class_loading_unloaded 1.0 # HELP idm_jvm_free_used_memory_bytes Automatically generated # TYPE idm_jvm_free_used_memory_bytes gauge idm_jvm_free_used_memory_bytes 9.77543264E8 # HELP idm_jvm_garbage_collector_g1_old_generation_count Automatically generated # TYPE idm_jvm_garbage_collector_g1_old_generation_count gauge idm_jvm_garbage_collector_g1_old_generation_count 0.0 # HELP idm_jvm_garbage_collector_g1_old_generation_time Automatically generated # TYPE idm_jvm_garbage_collector_g1_old_generation_time gauge idm_jvm_garbage_collector_g1_old_generation_time 0.0 # HELP idm_jvm_garbage_collector_g1_young_generation_count Automatically generated # TYPE idm_jvm_garbage_collector_g1_young_generation_count gauge idm_jvm_garbage_collector_g1_young_generation_count 82.0 # HELP idm_jvm_garbage_collector_g1_young_generation_time Automatically generated # TYPE idm_jvm_garbage_collector_g1_young_generation_time gauge idm_jvm_garbage_collector_g1_young_generation_time 2127.0 # HELP idm_jvm_max_memory_bytes Automatically generated # TYPE idm_jvm_max_memory_bytes gauge idm_jvm_max_memory_bytes 2.147483648E9 ... -
Start Prometheus with the
prometheus.ymlconfiguration file:prometheus --config.file=/path/to/prometheus.yml -
To confirm that Prometheus is gathering data from IDM, go to the Prometheus monitoring page (default
http://localhost:9090).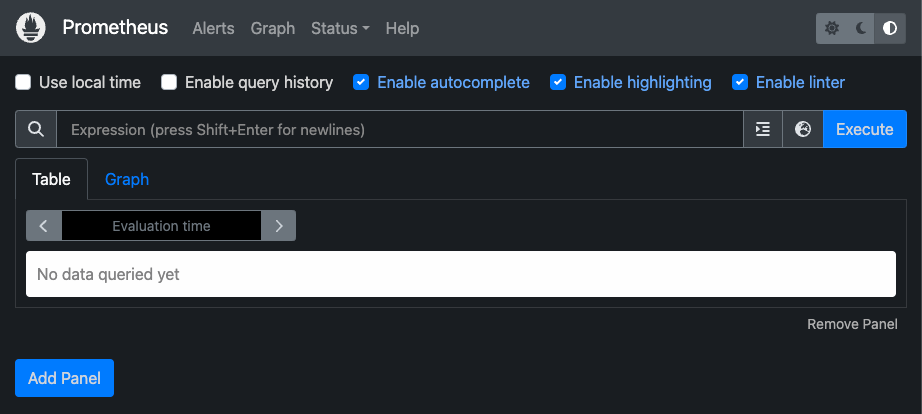
You can store your Prometheus credentials in the idm.prometheus.credentials well-defined purpose. This can allow for zero-downtime credentials rotation. For more information, refer to Store Prometheus credentials as a secret.
Configure Grafana
Prometheus lets you monitor and process information provided by IDM. If you need deeper analytics, you can use tools such as Grafana to create customized charts and graphs based on Prometheus data. For information on installing and running Grafana, refer to the Grafana website.
You can also monitor aspects of IDM’s performance using Prometheus to plug JVM metrics into a Grafana dashboard. For more information on using metrics to observe the system under load, refer to Load testing.
Before you get started, download the Monitoring Dashboard Samples from the Backstage download site. Open monitoring.dashboard.json from the downloaded .zip file, as you’ll need it during the following procedure.
|
To set up a Grafana dashboard with IDM metrics using Prometheus:
-
In a browser, go to the main Grafana page (default
http://localhost:3000) and log in.The default username and password for Grafana is admin. -
To add your Prometheus installation to Grafana as a data source, click the toggle menu button
 , and click Connections > Data sources.
 -
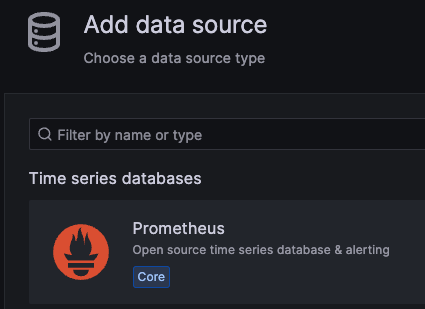
On the Data sources page, click Add data source.
-
On the Add data source page, select Prometheus.
-
Enter information and select options, as needed. The information you enter here should match the settings in the
monitoring.dashboard.jsonfile:-
Give your data source a name; for example,
PingIDM. -
Set the URL (default
http://localhost:9090). -
Enable Basic auth.
-
Enter the User (default
prometheus). -
Enter the Password (default
prometheus).
-
-
-
Click Save & test.
If the test succeeds, Grafana displays Data source is working.
Create a Grafana dashboard
After Prometheus has been configured as a data source in Grafana, you can create a dashboard with IDM metrics:
-
In Grafana, click the toggle menu button
, and click Dashboards. -
Click New, and do one of the following:
-
Select Import.
-
On the Import dashboard page, drag the
monitoring.dashboard.jsonfile from its location on your system to the Upload dashboard JSON file area. -
Enter information in the Options area, and select the Prometheus data source you previously created.
-
Click Import.
-
-
Select New dashboard.
-
Click Add visualization.
-
Select the Prometheus data source you previously created.
-
Configure the panel.
For more information, refer to:
-
-
Load testing
Load testing can help you get the most out of IDM and other Ping products. The benefits load testing provides include:
-
Reducing the chance that unexpected spikes in system activity will cause the system to become unstable
-
Allowing developers and system administrators to reason more accurately and be more confident in release cycle timelines
-
Providing baseline statistics which can be used to identify and investigate unexpected behavior
Load testing is a complex subject that requires knowledge of your system and a disciplined approach. There is no "one-size-fits-all" solution that applies in all circumstances. However, there are some basic principles to keep in mind while planning, executing, and evaluating load tests.
Plan tests
The first step is to determine what metrics need to be examined, what components are going to be tested, what levels of load are going to be used, and what response ranges are acceptable. Answering these questions requires:
-
Service-level Agreements (SLAs)
-
Understanding of your use case
-
Baseline knowledge of your system
SLAs provide a stationary, business-based target to aim for in testing. An example SLA appears as follows:
| Service/Endpoint | Sustained load | Peak load | Required response time |
|---|---|---|---|
Customer auth against LDAP repo |
50,000 over 16 hours |
4,000 per second three times in a 16-hour period |
200ms |
Employee auth against AD repo |
4,000 over 10 hours |
100/second |
400ms |
Customer registration |
1,000 over 24 hours |
10/second |
500ms |
Employee password reset |
10 over 24 hours |
1/second |
500ms |
Sample SLA warnings and details:
|
|||
Details will vary depending on your use case and application flow, present usage patterns, full load profile, and environment. To get the most benefit, collect this information.
The system’s full load profile depends on how it is designed and used. For example, some systems have thousands of clients each using a small slice of bandwidth, while others have only a few high-bandwidth connections. Understanding these nuances helps determine an appropriate number of connections and threads of execution to use to generate a test load.
| If you have trouble determining which systems and components are being used at various points during your application flow, consider modeling your application using a sequence diagram. |
Understand resource usage
Understanding what resources are heavily consumed by Ping products will help you with your test planning. The following chart details some products and their consumed resources:
| Product | Consumed resources |
|---|---|
AM with external stores |
CPU, memory |
DS as a user repository |
I/O, memory |
DS as a token store |
I/O, memory (if high token count) |
IDM |
I/O, CPU, and memory play an important role in provisioning and sync |
PingGateway |
CPU |
All of the above depends on network performance, including name resolution and proper load balancing when required. |
|
Execute tests
When it comes to executing tests, these are the basic principles to keep in mind:
-
Every system is different; "it depends" is the cardinal rule.
-
Testing scenarios that don’t happen in reality gives you test results that don’t happen in reality.
-
System performance is constrained by the scarcest resource.
One way to ensure that your tests reflect real use patterns is to begin with a load generator that creates periods of consistent use and periods of random spikes in activity. During the consistent periods, gradually add load until you exceed your SLAs and baselines. By using that data and the data from the periods of spiking activity, you can determine how your system handles spikes in activity in many different scenarios.
| Your load generator should be located on separate hardware/instances from your production systems. It should have adequate resources to generate the expected load. |
When testing systems with many components, begin by testing the most basic things — I/O, CPU, and memory use. IDM provides insight into these by exposing JVM Metrics.
Once you have an understanding of the basic elements of your system, introduce new components into the tests. Keep a record of each test’s environment and the components which were under test. These components may include:
-
Hardware/Hypervisor/Container platform
-
Hosting OS/VM/Container environment
-
Hosted OS
-
Java Virtual Machine (JVM)
-
Web/J2EE Container (if used to host PingAM/PingGateway or PingAM Agent)
-
Databases, repositories, and directory servers used with Ping
-
Networking, load balancers, and firewalls between instances
-
SSL, termination points, and other communications
-
Points of integration, if any
-
Other applications and services that utilize Ping components
-
Load generation configuration
-
Sample data, logs from test runs, and other generated files
| While there are many tools that can help you monitor your system, a thorough understanding of your system logs is the best path to understanding its behavior. |
|
To keep your results clear and focused, only add or adjust one variable at a time. Do not run tests designed to stress the system to its theoretical limit. The results you get from these stress tests rarely provide actionable insights. |
Change the JVM heap size
Changing the JVM heap size can improve performance and reduce the time it takes to run reconciliations.
You can set the JVM heap size via the OPENIDM_OPTS environment variable. If OPENIDM_OPTS is undefined, the JVM maximum heap size defaults to 2GB. For example, to set the minimum and maximum heap sizes to 4GB, enter the following before starting IDM:
-
Unix/Linux
-
Windows
cd /path/to/openidm/
export OPENIDM_OPTS="-Xms4096m -Xmx4096m"
./startup.sh
Using OPENIDM_HOME:   /path/to/openidm
Using PROJECT_HOME:   /path/to/openidm
Using OPENIDM_OPTS:   -Xms4096m -Xmx4096m
...
OpenIDM ready
cd \path\to\openidm
set OPENIDM_OPTS=-Xms4096m -Xmx4096m
startup.bat
"Using OPENIDM_HOME:   \path\to\openidm"
"Using PROJECT_HOME:   \path\to\openidm"
"Using OPENIDM_OPTS:   -Xms4096m -Xmx4096m -Dfile.encoding=UTF-8"
...
OpenIDM ready
You can also edit the OPENIDM_OPTS values in startup.sh or startup.bat.
Distributed tracing
| Distributed tracing is an Evolving feature in PingIDM. It is subject to change without notice, even in a minor or maintenance release. |
Distributed tracing helps you monitor and observe system requests as they flow through IDM. A request is tracked and analyzed with a unique identifier (ID) used to troubleshoot requests that show errors or performance issues. This unique ID remains with a transaction as it interacts with microservices, containers, and infrastructure.
When a user interacts with the Ping Identity Platform, the request can travel through multiple services before it completes. Distributed tracing lets you monitor the request flow through the Ping Identity Platform.
Tracing benefits
Distributed tracing makes it easier to:
-
Provide a single view of a request’s journey
-
Locate bottlenecks and errors
-
Identify slow services
-
Optimize application performance and reduce debugging time
-
Improve the end-user experience
IDM and OpenTelemetry
IDM supports the OpenTelemetry framework (OTEL) for collecting distributed tracing data.
OpenTelemetry handles:
-
Generation
-
Collection
-
Management
-
Export of telemetry
| OpenTelemetry does not handle telemetry storage and visualization. You can use a trace collector, such as Jaeger, to collect and visualize trace data. |
Request types supported in IDM
IDM supports distributed tracing for the following request types:
-
Incoming HTTP requests
-
Outgoing HTTP requests to PingAM (Ping Identity Platform deployments only)
-
Outgoing LDAP requests
These requests are searchable and identifiable for the following LDAP operations:
-
ADD
-
MODIFY
-
SEARCH
-
DELETE
-
BIND
-
-
Outgoing scripting HTTP requests
Outgoing scripting HTTP requests must use the openidm.actionfunction to make an external call using IDM’s external REST service.
Understand a trace object
A trace represents the path of a request through an application. A trace is made up of one or more spans.
Each span includes the following elements:
-
traceId: Representing the trace that the span is a part of -
spanId: A unique ID for that span -
parentSpanId: The ID of the originating request
The root span indicates the start and end of an entire operation. The parentSpanId of the root span is null because the root span isn’t part of an existing trace.
Subsequent spans in the trace have their own unique spanId. The traceId is the same as that of the root span. The parentId matches the spanId of the root span.
Learn more in Traces in the OpenTelemetry documentation.
Enable distributed tracing
| Distributed tracing is disabled by default. |
To enable distributed tracing:
-
In the
/path/to/openidmdirectory, create a/tracedirectory, for example, where you can place the tracing configuration file.The configuration file is not required to be in the /confdirectory. You can place this file in any location readable by IDM. -
In the
/tracedirectory, for example, create an OTEL configuration JSON file with the following information and set"enabled": true:{ "tracing": { "enabled": true, "exporter": { "type": "otlp", "config": { "endpoint": "http://localhost:4318/v1/traces" } } } }You can find information on additional configuration properties in Configure distributed tracing.
If the content of the configuration file is invalid JSON, distributed tracing remains disabled, even if you set "enabled": true. -
IDM uses the environment variable
OPENIDM_TRACING_CONFIG_PATH. Set this environment variable to point to the configuration file in/path/to/openidmor to any location readable by IDM, for example:OPENIDM_TRACING_CONFIG_PATH=/path/to/openidm/trace/tracing.json
-
After you create the OTEL configuration file in the directory that you choose and point the environment variable to the OTEL configuration file, start IDM.
Starting IDM launches a service that reads the OTEL configuration file and monitors it for changes to perform runtime updates to the distributed tracing service.
Configure distributed tracing
The Ping Identity Platform supports a common set of configuration properties for OpenTelemetry support.
|
To change the default OpenTelemetry configuration, add the configuration properties to your configuration file, for example:
{
  "tracing": {
    "enabled": true,
    "resourceAttributes": {
      "service.instance.id": "idm-server-1"
    },
    "exporter": {
      "config": {
        "headers": {
          "X-CUSTOM-HEADER": "custom-value"
        }
      }
    },
    "spanLimits": {
      "maxNumberOfAttributesPerEvent": 128
    }
  }
}
Distributed tracing configuration properties
- enabled: boolean, optional
-
Set to
trueto enable OpenTelemetry tracing.Default:
false - resourceAttributes: object, optional
-
A map of additional resource attributes for processing traces. Find more information in the OpenTelemetry documentation on Semantic Attributes with SDK-provided Default Value.
For example, if there are multiple Ping Identity Platform instances in a deployment, you could set the
"service.instance.id"resource attribute differently for each one to distinguish between them:{ "resourceAttributes": { "service.instance.id": "idm-server-1" } } - exporter: object, optional
-
Configuration for the exporter, which pushes traces to the OpenTelemetry service:
- type: string, optional
-
Set to
otlpfor OpenTelemetry Protocol (OTLP) support. This is currently the only supported protocol.Default:
otlp - config: object, optional
-
Endpoint and timeout configuration:
-
compressionMethod: enumeration, optionalMethod used to compress trace data; either
gzipornone.Default:
gzip -
connectionTimeout: duration, optionalTime out a connection to the endpoint after this duration.
Default: 10 seconds.
-
endpoint: string, optionalThe endpoint to publish traces to.
For HTTPS, IDM trusts the default JVM CAs. To override this, set the
-Djavax.net.ssl.trustStoreand associated JVM settings when starting IDM. Learn more about the optional settings in the Java Secure Socket Extension (JSSE) Reference Guide.IDM doesn’t support TLS configuration for the tracing endpoint at this time. Default:
http://localhost:4318/v1/traces -
headers: object, optionalMap of additional headers to include in the export span request.
The following example sets the authorization header,
Authorization: Bearer ${bearer.token}:"headers": { "Authorization": "Bearer ${bearer.token}" } -
retries: object, optionalDefines a retry policy for the export span requests.
Default: Enabled
-
backoffMultiplier: number, optional Multiplier for the backoff wait time before retries.Default: 1.5
-
enabled: boolean, optionalRetry failed requests.
Default:
true -
initialBackoff: duration, optionalHow long to wait before the first retry.
Default: 1 second
-
maxAttempts: number, optionalMaximum number of retries.
Default: 5
-
maxBackoff: duration, optionalMaximum wait time between retries.
Default: 5 seconds
-
-
timeout: duration, optionalTime out a request to publish data to the endpoint after this duration.
Default: 10 seconds.
-
batch: object, optional-
Enable and configure batch processing for trace data.
-
compressionMethod: enumeration, optionalMethod used to compress trace data; either
gzipornone.Default:
gzip -
enabled: boolean, optionalLeave batch processing enabled in deployment.
Default:
true -
exporterTimeout: duration, optionalTime out a data exporter after this duration.
Default: 30 seconds
-
exportUnsampledSpans: boolean, optionalWhether to report on unsampled spans.
Default:
false -
maxExportBatchSize: number, optionalMaximum number of spans in a batch.
Default: 512
-
maxQueueSize: number, optionalMaximum number of spans to queue before dropping them.
Default: 2048
-
scheduleDelay: duration, optionalMaximum interval between sending batches of trace data.
Default: 50 seconds
-
sampler: object, optional-
Configuration for sampling spans.
ratio: number, optional-
For ratio-based types, a percentage of spans to process.
Default: 50 (percent)
type: string, optional-
The sampler strategy to use is one of the following:
-
alwaysOn: Send every span for processing. -
alwaysOff: Never send any span for processing. -
traceIdRatio: Sample the specified ratio of spans deterministically based on the trace IDs of the spans. -
parentBasedAlwaysOn: Always send the span for processing if the parent span was sampled. (Default) -
parentBasedAlwaysOff: Never send the span for processing if the parent span was sampled. -
parentBasedTraceIdRatio: Send the specified ratio of spans for processing if the parent span was sampled.
-
spanLimits: object, optional-
Configuration for limits enforced when recording spans.
maxNumberOfAttributes: number, optional-
The maximum number of attributes per span.
Default: 128
maxNumberOfAttributesPerEvent: number, optional-
The maximum number of metadata items (attributes) attached to a span per event. An event is an annotation to span at a particular, meaningful point in time during the span’s duration.
Default: 128
maxNumberOfAttributesPerLink: number, optional-
The maximum number of attributes per link.
Default: 128
maxNumberOfEvents: number, optional-
The maximum number of events per span.
Default: 128
maxNumberOfLinks: number, optional-
The maximum number of links per span. Links associate the current span with one or more other spans.
Default: 128
Visualize traces with a trace collector
Trace collectors work alongside IDM, allowing the service to offload data quickly. A collector manages retries, batching, encryption, and data filtering.
You can use a trace collector to collect trace data from the OpenTelemetry Collector and visualize that data.
Example visualization with a trace collector
This example assumes a local IDM deployment.
-
Start the trace collector.
-
Send a request against IDM:
curl --location 'http://localhost:8080/openidm/schema/managed/user' \ --header 'x-openidm-username: openidm-admin' \ --header 'x-openidm-password: openidm-admin' -
Query the trace collector’s localhost URL for the request:
curl --location 'http://localhost:portnumber/api/traces?service=idm' -
You should receive a query response similar to the following:
{
  "data": [
    {
      "traceID": "09cb4130f4c8803011b3996f8bda6b8c",
      "spans": [
        {
          "traceID": "09cb4130f4c8803011b3996f8bda6b8c",
          "spanID": "e49cd1d70d65502d",
          "operationName": "GET /openidm",
          "references": [],
          "startTime": 1741892475358333,
          "duration": 165774,
          "tags": [
            {
              "key": "forgerock.transaction_id",
              "type": "string",
              "value": "c246e9ea-e596-4a99-a0eb-5072806cefe3-890"
            },
            {
              "key": "http.request.method",
              "type": "string",
              "value": "GET"
            },
            {
              "key": "network.protocol.name",
              "type": "string",
              "value": "http"
            },
            {
              "key": "otel.scope.name",
              "type": "string",
              "value": "idm"
            },
            {
              "key": "span.kind",
              "type": "string",
              "value": "server"
            },
            {
              "key": "url.full",
              "type": "string",
              "value": "http://localhost:8080/openidm/schema/managed/user"
            },
            {
              "key": "url.path",
              "type": "string",
              "value": "/openidm/schema/managed/user"
            }
          ],
          "logs": [],
          "processID": "p1",
          "warnings": null
        }
      ],
      ...
    }
  ]
}
Metrics reference
IDM exposes a number of metrics. All metrics are available at both the openidm/metrics/api and openidm/metrics/prometheus endpoints. The actual metric names can vary, depending on the endpoint used. Also refer to Monitoring.
Metric types
Metrics are organized into the following types:
Timer
Timers provide a histogram of the duration of an event, along with a measure of the rate of occurrences. Timers can be monitored using the Dropwizard dashboard widget and the IDM Prometheus endpoint. Durations in timers are measured in milliseconds. Rates are reported in number of calls per second. The following example shows a timer metric:
{
   "_id": "sync.source.perform-action",
   "count": 2,
   "max": 371.53391,
   "mean": 370.1752705,
   "min": 368.816631,
   "p50": 371.53391,
   "p75": 371.53391,
   "p95": 371.53391,
   "p98": 371.53391,
   "p99": 371.53391,
   "p999": 371.53391,
   "stddev": 1.3586395,
   "m15_rate": 0.393388581528647,
   "m1_rate": 0.311520313228562,
   "m5_rate": 0.3804917698002856,
   "mean_rate": 0.08572717156016606,
   "duration_units": "milliseconds",
   "rate_units": "calls/second",
   "total": 740.350541,
   "_type": "timer"
 }
Summary
Summaries are similar to timers in that they measure a distribution of events. However, summaries record values that aren’t units of time, such as user login counts. Summaries cannot be graphed in the Dropwizard dashboard widget, but are available through the Prometheus endpoint, and by querying the openidm/metrics/api endpoint directly. The following example shows a summary metric:
{
  "_id": "audit.recon",
  "m15_rate": 0.786777163057294,
  "m1_rate": 0.623040626457124,
  "m5_rate": 0.7609835396005712,
  "mean_rate": 0.16977218861919927,
  "units": "events/second",
  "total": 4,
  "count": 4,
  "_type": "summary"
}API metrics
Metrics accessed at the api endpoint (such as those consumed by the Dropwizard dashboard widget) use dot notation for their metric names; for example, recon.target-phase. The following table lists the API metrics available in IDM:
API metrics available in IDM
| API Metric Name | Type | Description |
|---|---|---|
|
Summary |
Count of all audit events generated of a given topic type. |
|
Timer |
Rate of reading response objects to fulfill the |
|
Timer |
Rate of reading response objects to fulfill the |
|
Timer |
Rate that filter scripts are executed per action. Monitors scripted filters and delegated admin. |
|
Timer |
Rate of ICF query executions with queryExpression and the time taken to perform this operation. |
|
Timer |
Rate of ICF query executions with queryFilter and the time taken to perform this operation. |
|
Timer |
Rate of ICF query executions with queryId and the time taken to perform this operation. |
|
Timer |
Rate of ICF query executions when the query type is UNKNOWN and the time taken to perform this operation. |
|
Timer |
|
|
Timer |
Rate of ICF create operations and operation performance time for the given connector. |
|
Timer |
Rate of ICF delete operations and operation performance time for the given connector. |
|
Timer |
Rate of ICF patch operations and operation performance time for the given connector. |
|
Timer |
Rate of ICF read operations and operation performance time for the given connector. |
|
Timer |
Rate of ICF update operations and operation performance time for the given connector. |
|
Timer |
Rate of operations on internal objects. |
|
Timer |
Rate of fetch operations of relationship fields for internal objects. |
|
Timer |
Query rate on relationship values for internal objects. |
|
Timer |
Rate of script executions on internal object. |
|
Timer |
Rate of validate operations of relationship fields for internal objects. |
|
Duration of live sync on a system object. |
|
|
Timer |
Rate of responses requiring field augmentation. When the repository cannot retrieve all data in a single call, IDM performs additional read operations to complete (augment) the missing data. |
|
Timer |
Rate of operations on a managed object. |
|
Timer |
Rate of fetches of relationship fields of a managed object. |
|
Timer |
Rate of queries to get relationship values for a resource on a managed object. |
|
Timer |
Rate of validations of relationship fields of a managed object. |
|
Timer |
Rate of executions of a script on a managed object. |
|
Timer |
Latency of enforcing temporal constraints on role objects during object creation. |
|
Timer |
Latency of enforcing temporal constraints on role objects during object deletion. |
|
Timer |
Latency of enforcing temporal constraints on role objects during object update. |
|
Timer |
Latency of enforcing temporal constraints on relationship grants during edge creation. |
|
Timer |
Latency of enforcing temporal constraints on relationship grants during edge deletion. |
|
Timer |
Latency of enforcing temporal constraints on relationship grants during edge update. |
|
Timer |
Rate of reads on relationship endpoint edges for validation. |
|
Timer |
Time spent in filter that maps non-nullable and null-valued array fields to an empty array. This filter is traversed for all repo access relating to internal and managed objects. |
|
Timer |
Rate of executions of a full reconciliation, and time taken to perform this operation. |
|
Timer |
Rate of merge operations after source and/or target objects have been retrieved during a merged query of recon association entries. |
|
Timer |
Rate of individual paged recon association entry queries during a merged query. More than one page of entries might be requested to build a single page of merged results. |
|
Timer |
Rate of source object retrieval via query when merging source objects to recon association entries. |
|
Timer |
Rate of target object retrieval via query when merging target objects to recon association entries. |
|
Timer |
The time taken to persist association data. The operation can be |
|
Timer |
Rate of executions of the id query phase of a reconciliation, and time taken to perform this operation. |
|
Timer |
Rate of executions of the source phase of a reconciliation, and time taken to perform this operation. |
|
Timer |
Rate of pagination executions of the source phase of a reconciliation, and time taken to perform this operation. |
|
Timer |
Rate of executions of the target phase of a reconciliation, and time taken to perform this operation. |
|
Timer |
Time (ms) spent running the Edge→Vertex relationship join query on the database and collecting the result set. |
|
Timer |
Rate of relationship graph query execution times. |
|
Timer |
Rate of relationship graph query result processing times. |
|
Timer |
Rate of executions of a query with queryId at a repository level and the time taken to perform this operation. |
|
Count |
Counts the usage statistics of the |
|
Timer |
Rate of retrievals of a repository connection. |
|
Timer |
Rate of actions to a repository datasource for a generic/explicit mapped table. |
|
Timer |
Rate of filtered queries (using native query expressions) on the relationship table. This metric measures the time spent making the query (in ms), and the number of times the query is invoked. |
|
Timer |
Rate of filtered queries (using the |
|
Timer |
Rate of execution time on the JDBC database for the |
|
Timer |
Rate of execution time on the JDBC database for CRUD operations. This rate does not include the time taken to obtain a connection to the database from the connection pool. The physical connections to the database have already been established inside the connection pool. |
|
Timer |
Rate of execution time on the JDBC database for queries (either |
|
Timer |
Rate of CRUDPAQ operations to a repository datasource for a generic/explicit/relationship mapped table. |
|
Timer |
Time (ms) spent in the various phases to retrieve relationship expanded data referenced by queried objects. |
|
Timer |
Rate of initiations of a CRUDPAQ operation to a repository datasource. |
|
Timer |
Rate of actions over the router and the time taken to perform this operation. |
|
Timer |
Rate of creates over the router and the time taken to perform this operation. |
|
Timer |
Rate of deletes over the router and the time taken to perform this operation. |
|
Timer |
Rate of patches over the router and the time taken to perform this operation. |
|
Timer |
Rate of queries with queryExpression completed over the router and the time taken to perform this operation. |
|
Timer |
Rate of queries with queryFilter completed over the router and the time taken to perform this operation. |
|
Timer |
Rate of reads over the router and the time taken to perform this operation. |
|
Timer |
Rate of updates over the router and the time taken to perform this operation. |
|
Timer |
Rate of calls to a script and time taken to complete. |
|
Timer |
Rate of requests to create a target object, and time taken to perform the operation. |
|
Timer |
Rate of requests to delete a target object, and time taken to perform the operation. |
|
Timer |
Rate of configurations applied to a mapping. |
|
Timer |
Rate of acquisition of queued synchronization events from the queue. |
|
Timer |
Rate of deletion of synchronization events from the queue. |
|
Timer |
Rate at which queued synchronization operations are executed. |
|
Summary |
Number of queued synchronization operations that failed. |
|
Summary |
Number of queued synchronization events acquired by another node in the cluster. |
|
Summary |
Number of queued synchronization events rejected because the backing thread-pool queue was at full capacity and the thread-pool had already allocated its maximum configured number of threads. |
|
Timer |
Rate at which queued synchronization events are released. |
|
Timer |
Times the release of queued synchronization events after a failure and before exceeding the retry count. |
|
Timer |
Rate of insertion of synchronization events into the queue. |
|
Timer |
The latency involved in polling for synchronization events. |
|
Timer |
Rate of reads of an object. |
|
Timer |
Rate of assessments of a synchronization situation. |
|
Timer |
Rate of correlations between a target and a given source, and time taken to perform this operation. |
|
Timer |
Rate of determinations done on a synchronization action based on its current situation. |
|
Timer |
Rate of completions of an action performed on a synchronization operation. |
|
Timer |
Rate of assessments of a target situation. |
|
Timer |
Rate of determinations done on a target action based on its current situation. |
|
Timer |
Rate of completions of an action performed on a target sync operation. |
|
Timer |
Rate of requests to update an object on the target, and the time taken to perform this operation. |
|
Summary |
Count of all successful logins by user type. |
|
Summary |
Count of all successful logins by user type and provider. |
|
Summary |
Number of 404 responses encountered when querying the |
|
Summary |
Number of edges skipped due to an unsatisfied temporal constraint on either the edge or the referred-to vertex. Encountered when querying the resource collection and relationship field at the traversal_depthX tag for the most recent X. |
|
Timer |
Time spent traversing relationship fields to calculate the specified virtual properties. The managed objects linked to by the traversal relationship fields define a tree whose root is the virtual property host. This object tree is traversed depth-first with the traversal_depthX corresponding to the latency involved with each relationship traversal. Traversal_depth0 corresponds to the first relationship field traversed. Because the tree is traversed depth-first, traversal_depthX subsumes all the traversal latencies for all traversal_depth Y, where Y>X. |
API JVM metrics available in IDM
| These metrics depend on the JVM version and configuration. In particular, garbage-collector-related metrics depend on the garbage collector that the server uses. The garbage-collector metric names are unstable and can change even in a minor JVM release. |
| API Metric Name | Type | Unit | Description |
|---|---|---|---|
|
Gauge |
Count |
Number of processors available to the JVM. For more information, refer to Runtime. |
|
Counter |
Count |
Number of classes loaded since the Java virtual machine started. For more information, refer to ClassLoadingMXBean. |
|
Counter |
Count |
Number of classes unloaded since the Java virtual machine started. For more information, refer to ClassLoadingMXBean. |
|
Gauge |
Bytes |
For more information, refer to Runtime. |
|
Count |
Count |
For each garbage collector in the JVM. For more information, refer to GarbageCollectorMXBean. |
|
Counter |
Milliseconds |
|
|
Counter |
Count |
|
|
Counter |
Milliseconds |
|
|
Gauge |
Bytes |
For more information, refer to Runtime. |
|
Gauge |
Bytes |
Amount of heap memory committed for the JVM to use. For more information, refer to MemoryMXBean. |
|
Gauge |
Bytes |
|
|
Gauge |
Bytes |
Maximum amount of heap memory available to the JVM. |
|
Gauge |
Bytes |
Amount of heap memory used by the JVM. |
|
Gauge |
Bytes |
Amount of non-heap memory committed for the JVM to use. |
|
Gauge |
Bytes |
Amount of non-heap memory the JVM initially requested from the operating system. |
|
Gauge |
Bytes |
Maximum amount of non-heap memory available to the JVM. |
|
Gauge |
Bytes |
Amount of non-heap memory used by the JVM. |
|
Gauge |
Bytes |
For each pool. For more information, refer to MemoryPoolMXBean. |
|
Gauge |
Bytes |
|
|
Gauge |
Bytes |
|
|
Gauge |
Bytes |
|
|
Gauge |
Bytes |
|
|
Gauge |
Bytes |
|
|
Gauge |
Bytes |
|
|
Gauge |
Bytes |
|
|
Gauge |
Bytes |
|
|
Gauge |
Bytes |
|
|
Gauge |
Bytes |
|
|
Gauge |
Bytes |
|
|
Gauge |
Bytes |
|
|
Gauge |
Bytes |
|
|
Gauge |
Bytes |
|
|
Gauge |
Bytes |
|
|
Gauge |
Bytes |
|
|
Gauge |
Bytes |
|
|
Gauge |
Bytes |
|
|
Gauge |
Bytes |
|
|
Gauge |
Bytes |
|
|
Gauge |
Bytes |
|
|
Gauge |
Bytes |
|
|
Gauge |
Bytes |
|
|
Gauge |
Bytes |
|
|
Gauge |
Bytes |
|
|
Gauge |
Bytes |
|
|
Gauge |
Bytes |
|
|
Gauge |
Bytes |
|
|
Gauge |
Bytes |
|
|
Gauge |
Bytes |
|
|
Gauge |
Bytes |
|
|
Gauge |
Bytes |
|
|
Gauge |
Bytes |
|
|
Gauge |
Bytes |
|
|
Gauge |
Count |
For more information, refer to ThreadMXBean. |
|
Gauge |
Count |
Number of live daemon threads. |
|
Gauge |
Count |
Number of threads in the |
|
Gauge |
Count |
Number of threads in the |
|
Gauge |
Count |
Number of threads in the |
|
Gauge |
Count |
Number of threads in the |
|
Gauge |
Count |
Number of threads in the |
|
Gauge |
Bytes |
For more information, refer to totalMemory(). |
| Deprecated metrics are not shown in the previous table. |
API scheduler metrics available in IDM
For example requests, refer to Scheduler metrics.
| API Metric Name | Type | Description |
|---|---|---|
|
Summary |
A summary of completed jobs for the specified job-group and job-name. |
|
Timer |
Time spent on executed jobs for the specified job-group and job-name. |
|
Timer |
Time spent storing scheduled jobs in the repository for the specified operation and scheduler-object. |
|
Summary |
A summary of successfully acquired jobs. |
|
Summary |
A summary of acquired jobs that time out. |
|
Summary |
A summary of fired schedule triggers. |
|
Summary |
A summary of misfired schedule triggers. |
|
Timer |
Time spent on recovered triggers. |
|
Timer |
Execution rate of scheduler requests for the specified type and operation. |
API workflow metrics available in IDM
| API Metric Name | Type | Description |
|---|---|---|
|
Timer |
Time spent invoking a message event. |
|
Timer |
Time spent invoking a signal event. |
|
Timer |
Time spent triggering an execution. |
|
Timer |
Time spent querying executions. |
|
Timer |
Time spent forcing synchronous execution of a job. |
|
Timer |
Time spent displaying the stacktrace for a job that triggered an exception. |
|
Timer |
Time spent deleting a job. |
|
Timer |
Time spent querying jobs. |
|
Timer |
Time spent reading a single job. |
|
Timer |
Time spent to execute dead-letter job. |
|
Timer |
Time spent to retrieve the stacktrace for a dead-letter job. |
|
Timer |
Time spent to delete a dead letter job. |
|
Timer |
Time spent to query dead letter jobs. |
|
Timer |
Time spent to read a dead letter job. |
|
Timer |
Time spent to deploy a model. |
|
Timer |
Time spent to list model deployments. |
|
Timer |
Time spent to validate BPMN content. |
|
Timer |
Time spent to create a model. |
|
Timer |
Time spent to delete a model. |
|
Timer |
Time spent to query models. |
|
Timer |
Time spent to read a model. |
|
Timer |
Time spent to update a model. |
|
Timer |
Time spent to delete a process definition. |
|
Timer |
Time spent to query process definitions. |
|
Timer |
Time spent to read a process definition. |
|
Timer |
Time spent to migrate a process instance. |
|
Timer |
Time spent to validate a migration of a process instance. |
|
Timer |
Time spent to create a process instance. |
|
Timer |
Time spent to delete a process instance. |
|
Timer |
Time spent to query process instances. |
|
Timer |
Time spent to read a process instance. |
|
Timer |
Time spent to query task definitions. |
|
Timer |
Time spent to read a task definition. |
|
Timer |
Time spent to complete a task instance. |
|
Timer |
Time spent to query task instances. |
|
Timer |
Time spent to read a task instance. |
|
Timer |
Time spent to update a task instance. |
Prometheus metrics
Metrics accessed through the Prometheus endpoint are prepended with idm_ and use underscores between words; for example, idm_recon_target_phase_seconds. The following table lists the Prometheus metrics available in IDM:
Prometheus metrics available in IDM
| Prometheus Metric Name | Type | Description |
|---|---|---|
|
Summary |
Count of all audit events generated of a given topic type. |
|
Timer |
Rate of reading response objects, to fulfill the |
|
Timer |
Rate of reading response objects, to fulfill the |
|
Timer |
Rate at which filter scripts are executed, per action. Monitors scripted filters and delegated admin. |
|
Timer |
Rate of ICF query executions with queryExpression, and time taken to perform this operation. |
|
Timer |
Rate of ICF query executions with queryFilter, and time taken to perform this operation. |
|
Timer |
Rate of ICF query executions with queryId, and time taken to perform this operation. |
|
Timer |
Rate of ICF query executions when the query type is UNKNOWN, and time taken to perform this operation. |
|
Timer |
Rate of ICF authentication actions and action performance time for the given connector. |
|
Timer |
Rate of ICF create operations and operation performance time for the given connector. |
|
Timer |
Rate of ICF delete operations and operation performance time for the given connector. |
|
Timer |
Rate of ICF patch operations and operation performance time for the given connector. |
|
Timer |
Rate of ICF read operations and operation performance time for the given connector. |
|
Timer |
Rate of ICF update operations and operation performance time for the given connector. |
|
Timer |
Rate of fetch operations of relationship fields for internal objects. |
|
Timer |
Query rate on relationship values for internal objects. |
|
Timer |
Rate of validate operations of relationship fields for internal objects. |
|
Timer |
Rate of script executions on internal objects. |
|
Timer |
Rate of operations on internal objects. |
|
Timer |
Duration of live sync on a system object. |
|
Timer |
Rate of responses requiring field augmentation. When the repository is unable to retrieve all the data in a single call, IDM performs additional read operations to complete (augment) the missing data. |
|
Timer |
Rate of fetches of relationship fields of a managed object. |
|
Timer |
Rate of queries to get relationship values for a resource on a managed object. |
|
Timer |
Rate of validations of relationship fields of a managed object. |
|
Timer |
Rate of executions of a script on a managed object. |
|
Timer |
Latency of enforcing temporal constraints on role objects during object creation. |
|
Timer |
Latency of enforcing temporal constraints on role objects during object deletion. |
|
Timer |
Latency of enforcing temporal constraints on role objects during object update. |
|
Timer |
Latency of enforcing temporal constraints on relationship grants during edge creation. |
|
Timer |
Latency of enforcing temporal constraints on relationship grants during edge deletion. |
|
Timer |
Latency of enforcing temporal constraints on relationship grants during edge update. |
|
Timer |
Rate of reads on relationship endpoint edges for validation. |
|
Timer |
Rate of operations on a managed object. |
|
Timer |
Time spent in filter which maps non-nullable, null-valued array fields to an empty array. This filter is traversed for all repo access relating to internal and managed objects. |
|
Timer |
Rate of merge operations after source and/or target objects have been retrieved during a merged query of recon association entries. |
|
Timer |
Rate of individual paged recon association entry queries during a merged query. More than one page of entries might be requested to build a single page of merged results. |
|
Timer |
Rate of source object retrieval via query when merging source objects to recon association entries. |
|
Timer |
Rate of target object retrieval via query when merging target objects to recon association entries. |
|
Timer |
The time taken to persist association data. The operation can be |
|
Timer |
Rate of executions of the id query phase of a reconciliation, and time taken to perform this operation. |
|
Timer |
Rate of executions of a full reconciliation, and time taken to perform this operation. |
|
Timer |
Rate of pagination executions of the source phase of a reconciliation, and time taken to perform this operation. |
|
Timer |
Rate of executions of the source phase of a reconciliation, and time taken to perform this operation. |
|
Timer |
Rate of executions of the target phase of a reconciliation, and time taken to perform this operation. |
|
Timer |
Rate of filtered queries (using native query expressions) on the relationship table. This metric measures the time spent making the query (in ms), and the number of times the query is invoked. |
|
Timer |
Rate of filtered queries (using the |
|
Timer |
Rate of execution time on the JDBC database for the |
|
Timer |
Rate of execution time on the JDBC database for CRUD operations. This rate does not include the time taken to obtain a connection to the database from the connection pool. The physical connections to the database have already been established inside the connection pool. |
|
Timer |
Rate of execution time on the JDBC database for queries (either |
|
Timer |
Rate of retrievals of a repository connection. |
|
Count |
Counts the usage statistics of the |
|
Timer |
Time (ms) spent running the Edge→Vertex relationship join query on the database and collecting the result set. |
|
Timer |
Rate of relationship graph query execution times. |
|
Timer |
Rate of relationship graph query result processing times. |
|
Timer |
Rate of executions of a query with queryId at a repository level, and time taken to perform this operation. |
|
Timer |
Time (ms) spent in the various phases to retrieve relationship expanded data referenced by queried objects. |
|
Timer |
Rate of CRUDPAQ operations to a repository datasource for a generic/explicit/relationship mapped table. |
|
Timer |
Rate of actions to a repository datasource for a generic/explicit mapped table. |
|
Timer |
Rate of initiations of a CRUDPAQ operation to a repository datasource. |
|
Timer |
Rate of actions over the router, and time taken to perform this operation. |
|
Timer |
Rate of creates over the router, and time taken to perform this operation. |
|
Timer |
Rate of deletes over the router, and time taken to perform this operation. |
|
Timer |
Rate of patches over the router, and time taken to perform this operation. |
|
Timer |
Rate of queries with queryExpression completed over the router, and time taken to perform this operation. |
|
Timer |
Rate of queries with queryFilter completed over the router, and time taken to perform this operation. |
|
Timer |
Rate of reads over the router, and time taken to perform this operation. |
|
Timer |
Rate of updates over the router, and time taken to perform this operation. |
|
Timer |
Rate of calls to a script and time taken to complete. |
|
Timer |
Rate of requests to create an object on the target, and the time taken to perform this operation. |
|
Timer |
Rate of requests to delete an object on the target, and the time taken to perform this operation. |
|
Timer |
Rate of configurations applied to a mapping. |
|
Timer |
Rate of acquisition of queued synchronization events from the queue. |
|
Timer |
Rate of deletion of synchronization events from the queue. |
|
Timer |
Rate at which queued synchronization operations are executed. |
|
Summary |
Number of queued synchronization operations that failed. |
|
Timer |
The latency involved in polling for synchronization events. |
|
Summary |
Number of queued synchronization events that were acquired by another node in the cluster. |
|
Summary |
Number of queued synchronization events that were rejected because the backing thread-pool queue was at full capacity and the thread-pool had already allocated its maximum configured number of threads. |
|
Timer |
Times the release of queued synchronization events after a failure and before exceeding the retry count. |
|
Timer |
Rate at which queued synchronization events are released. |
|
Timer |
Rate of insertion of synchronization events into the queue. |
|
Timer |
Rate of reads of an object. |
|
Timer |
Rate of assessments of a synchronization situation. |
|
Timer |
Rate of correlations between a target and a given source, and time taken to perform this operation. |
|
Timer |
Rate of determinations done on a synchronization action based on its current situation. |
|
Timer |
Rate of completions of an action performed on a synchronization operation. |
|
Timer |
Rate of assessments of a target situation. |
|
Timer |
Rate of determinations done on a target action based on its current situation. |
|
Timer |
Rate of completions of an action performed on a target sync operation. |
|
Timer |
Rate of requests to update an object on the target, and the time taken to perform this operation. |
|
Summary |
Count of all successful logins by user type. |
|
Summary |
Count of all successful logins by user type and provider. |
|
Summary |
Number of 404 responses encountered when querying the |
|
Summary |
Number of edges skipped due to an unsatisfied temporal constraint on either the edge or the referred-to vertex. Encountered when querying the resource collection and relationship field at the traversal_depthX tag for the most recent X. X corresponds to the relationship field sequence. |
|
Timer |
Time spent traversing relationship fields to calculate the specified virtual properties. The managed objects linked to by the traversal relationship fields define a tree, whose root is the virtual property host. This object tree is traversed depth-first, with the traversal_depthX corresponding to the latency involved with each relationship traversal. Traversal_depth0 corresponds to the first relationship field traversed. Because the tree is traversed depth-first, traversal_depthX will subsume all the traversal latencies for all traversal_depth Y, where Y>X. X corresponds to the relationship field sequence. |
Prometheus JVM metrics available in IDM
| These metrics depend on the JVM version and configuration. In particular, garbage-collector-related metrics depend on the garbage collector that the server uses. The garbage-collector metric names are unstable, and can change even in a minor JVM release. |
| Prometheus Metric Name | Type | Unit | Description |
|---|---|---|---|
|
Gauge |
Count |
Number of processors available to the JVM. For more information, refer to Runtime. |
|
Counter |
Count |
Number of classes loaded since the Java virtual machine started. For more information, refer to ClassLoadingMXBean. |
|
Counter |
Count |
Number of classes unloaded since the Java virtual machine started. For more information, refer to ClassLoadingMXBean. |
|
Gauge |
Bytes |
For more information, refer to Runtime. |
|
Count |
Count |
For each garbage collector in the JVM. For more information, refer to GarbageCollectorMXBean. |
|
Counter |
Milliseconds |
|
|
Counter |
Count |
|
|
Counter |
Milliseconds |
|
|
Gauge |
Bytes |
For more information, refer to Runtime. |
|
Gauge |
Bytes |
Amount of heap memory committed for the JVM to use. For more information, refer to MemoryMXBean. |
|
Gauge |
Bytes |
|
|
Gauge |
Bytes |
Maximum amount of heap memory available to the JVM. |
|
Gauge |
Bytes |
Amount of heap memory used by the JVM. |
|
Gauge |
Bytes |
Amount of non-heap memory committed for the JVM to use. |
|
Gauge |
Bytes |
Amount of non-heap memory the JVM initially requested from the operating system. |
|
Gauge |
Bytes |
Maximum amount of non-heap memory available to the JVM. |
|
Gauge |
Bytes |
Amount of non-heap memory used by the JVM. |
|
Gauge |
Bytes |
For each pool. For more information, refer to MemoryPoolMXBean. |
|
Gauge |
Bytes |
|
|
Gauge |
Bytes |
|
|
Gauge |
Bytes |
|
|
Gauge |
Bytes |
|
|
Gauge |
Bytes |
|
|
Gauge |
Bytes |
|
|
Gauge |
Bytes |
|
|
Gauge |
Bytes |
|
|
Gauge |
Bytes |
|
|
Gauge |
Bytes |
|
|
Gauge |
Bytes |
|
|
Gauge |
Bytes |
|
|
Gauge |
Bytes |
|
|
Gauge |
Bytes |
|
|
Gauge |
Bytes |
|
|
Gauge |
Bytes |
|
|
Gauge |
Bytes |
|
|
Gauge |
Bytes |
|
|
Gauge |
Bytes |
|
|
Gauge |
Bytes |
|
|
Gauge |
Bytes |
|
|
Gauge |
Bytes |
|
|
Gauge |
Bytes |
|
|
Gauge |
Bytes |
|
|
Gauge |
Bytes |
|
|
Gauge |
Bytes |
|
|
Gauge |
Bytes |
|
|
Gauge |
Bytes |
|
|
Gauge |
Bytes |
|
|
Gauge |
Bytes |
|
|
Gauge |
Bytes |
|
|
Gauge |
Bytes |
|
|
Gauge |
Bytes |
|
|
Gauge |
Bytes |
|
|
Gauge |
Count |
For more information, refer to ThreadMXBean. |
|
Gauge |
Count |
Number of live daemon threads. |
|
Gauge |
Count |
Number of threads in the |
|
Gauge |
Count |
Number of threads in the |
|
Gauge |
Count |
Number of threads in the |
|
Gauge |
Count |
Number of threads in the |
|
Gauge |
Count |
Number of threads in the |
|
Gauge |
Bytes |
For more information, refer to totalMemory(). |
| Deprecated metrics are not shown in the previous table. |
Prometheus scheduler metrics available in IDM
| Prometheus Metric Name | Type | Description |
|---|---|---|
|
Summary |
A summary of completed jobs for the specified job-group and job-name. |
|
Timer |
Time spent on executed jobs for the specified job-group and job-name. |
|
Timer |
Time spent storing scheduled jobs in the repository for the specified operation and scheduler-object. |
|
Summary |
A summary of successfully acquired jobs. |
|
Summary |
A summary of acquired jobs that time out. |
|
Summary |
A summary of fired schedule triggers. |
|
Summary |
A summary of misfired schedule triggers. |
|
Timer |
Time spent on recovered triggers. |
|
Timer |
Execution rate of scheduler requests for the specified type and operation. |
Prometheus workflow metrics available in IDM
| Prometheus Metric Name | Type | Description |
|---|---|---|
|
Timer |
Time spent invoking a message event. |
|
Timer |
Time spent invoking a signal event. |
|
Timer |
Time spent triggering an execution. |
|
Timer |
Time spent querying executions. |
|
Timer |
Time spent forcing synchronous execution of a job. |
|
Timer |
Time spent displaying the stacktrace for a job that triggered an exception. |
|
Timer |
Time spent deleting a job. |
|
Timer |
Time spent querying jobs. |
|
Timer |
Time spent reading a single job. |
|
Timer |
Time spent to execute dead-letter job. |
|
Timer |
Time spent to retrieve the stacktrace for a dead-letter job. |
|
Timer |
Time spent to delete a dead letter job. |
|
Timer |
Time spent to query dead letter jobs. |
|
Timer |
Time spent to read a dead letter job. |
|
Timer |
Time spent to deploy a model. |
|
Timer |
Time spent to list model deployments. |
|
Timer |
Time spent to validate BPMN content. |
|
Timer |
Time spent to create a model. |
|
Timer |
Time spent to delete a model. |
|
Timer |
Time spent to query models. |
|
Timer |
Time spent to read a model. |
|
Timer |
Time spent to update a model. |
|
Timer |
Time spent to delete a process definition. |
|
Timer |
Time spent to query process definitions. |
|
Timer |
Time spent to read a process definition. |
|
Timer |
Time spent to migrate a process instance. |
|
Timer |
Time spent to validate a migration of a process instance. |
|
Timer |
Time spent to create a process instance. |
|
Timer |
Time spent to delete a process instance. |
|
Timer |
Time spent to query process instances. |
|
Timer |
Time spent to read a process instance. |
|
Timer |
Time spent to query task definitions. |
|
Timer |
Time spent to read a task definition. |
|
Timer |
Time spent to complete a task instance. |
|
Timer |
Time spent to query task instances. |
|
Timer |
Time spent to read a task instance. |
|
Timer |
Time spent to update a task instance. |