Advanced HTTP event logging
The PingAuthorize Server provides advanced HTTP event logging through the file-based trace logger to help diagnose slowdowns in HTTP request processing.
By capturing the full lifecycle of HTTP requests, you can identify performance bottlenecks and fine-tune the server for your workload.
HTTP request lifecycle
The typical HTTP request lifecycle in the PingAuthorize Server is as follows:
-
The server accepts a low-level channel.
This begins the request lifecycle at the lowest level of the network stack.
-
Example log:
HTTP-EVENT CHANNEL channelID=89 msg="accepting channel"
-
-
The client establishes a TCP socket with the server.
This creates the foundational network connection.
-
Example log:
HTTP-EVENT SOCKET socketID=90 remotePort="63418" localPort="8443" msg="opened"
-
-
An HTTP connection is established over the socket.
The server is now ready to listen for HTTP-specific traffic.
-
Example log:
HTTP-EVENT CONNECTION connectionID=90 channelID=90 socketID=89 msg="open"
-
-
The server begins processing the client request.
The server receives the request and assigns it to a handler thread.
-
Example log:
HTTP-EVENT REQUEST-PROCESSING requestHash=1453742073 connectionID=90 channelID=90 socketID=89 method=POST URL="http://localhost:8443/governance-engine" msg="begin request"

HTTP-EVENT REQUEST-PROCESSING requestHash=1453742073 connectionID=90 channelID=90 socketID=89 method=POST URL="http://localhost:8443/governance-engine" msg="dispatching request"
-
-
The server finishes processing the request and sends a response.
This log entry is especially important for performance analysis, as it contains the total request processing duration and the queue time.
-
Example log:
HTTP-EVENT REQUEST-PROCESSING requestID=146 correlationID="7fed277a-c867-4571-9f6d-591722f8754c" requestHash=1453742073 connectionID=90 channelID=90 socketID=89 method=POST URL="https://localhost:8443/governance-engine" totalDurationMs=167 queueDurationMs=1 requestDurationMs=45 requestContentLength=8 responseDurationMs=0 responseContentLength=281 requestBeginTime="23/Jun/2025:20:46:52.037 -0500" dispatchTime="23/Jun/2025:20:46:52.037 -0500" requestEndTime="23/Jun/2025:20:46:52.082 -0500" responseBeginTime="23/Jun/2025:20:46:52.202 -0500" responseEndTime="23/Jun/2025:20:46:52.202 -0500" requestCompleteTime="23/Jun/2025:20:46:52.204 -0500" msg="complete processing"
-
-
The server closes the connection.
After sending the response, the server can close the HTTP connection. For persistent connections, this step might be delayed until a timeout or until the client explicitly closes it.
-
Example log:
HTTP-EVENT CONNECTION connectionID=89 channelID=89 totalDurationMs=6 openTime="23/Jun/2025:20:46:52.029 -0500" closeTime="23/Jun/2025:20:46:52.035 -0500" msg="close"
-
-
The server closes the underlying TCP socket.
The server terminates the low-level network socket, freeing up the resource.
-
Example log:
HTTP-EVENT SOCKET socketID=90 remotePort="63418" localPort="8443" totalDurationMs=4 incomingBytes=0 outgoingBytes=0 socketOpenedTime="23/Jun/2025:20:46:52.029 -0500" socketClosedTime="23/Jun/2025:20:46:52.033 -0500" msg="closed"
-
Each HTTP event includes a unique identifier that allows you to trace the full lifecycle of a request and pinpoint exactly where delays occur, whether in connection setup, thread queuing, or request handling.
Enabling HTTP event logging
To trace the complete lifecycle of HTTP requests, configure the http-event property in the file-based trace logger.
You can individually enable the following HTTP event types:
| HTTP event type | Description |
|---|---|
|
Logs when a TCP socket is opened, closed, or reused. The close event includes the total duration the socket was open. |
|
Logs when an HTTP connection is opened, closed, or reused. The close event includes the total duration of the connection. |
|
Logs low-level channel events related to the connection. |
|
Logs when request processing starts and finishes. The finish event includes the total request processing duration and the queue time (the time the request spent waiting for a handler thread). |
|
The queue time calculation logged by |
You can use the administrative console or dsconfig to enable detailed HTTP event logging.
|
High-volume logging can impact performance, so you should only enable event types relevant to your troubleshooting goals. |
By default, the file-based trace logger writes messages to the logs/trace.log file.
-
Admin console
-
dsconfig
Steps
-
Go to Logging, Monitoring, and Notifications > Log Publishers.
-
Click File-Based Trace Logger.
-
Select the Enabled checkbox if the logger isn’t already enabled.
-
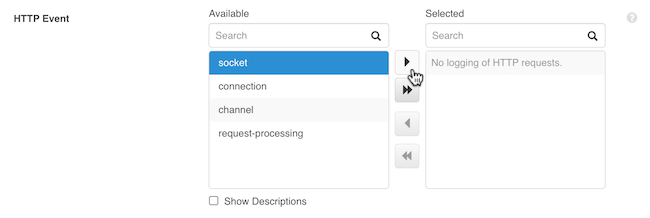
Go to Log Messages To Include > HTTP Event.
-
In the Available list, select an HTTP event type and click the right arrow to move it to the Selected list.
-
Click Save.
Result
The file-based trace logger now logs messages for the selected event type.
Steps
-
Use the
dsconfig set-log-publisher-propcommand with the--add http-eventargument to enable specific HTTP event types.The following example enables logging for socket and request processing events:
dsconfig set-log-publisher-prop \
  --publisher-name "File-Based Trace Logger" \
  --add http-event:socket \
  --add http-event:request-processing
Result
The file-based trace logger now logs messages for the specified event types.